How to Calculate Food Cost Percentage (and Hit a Healthy Target)
Food cost percentage is the single number that tells you whether your kitchen is making money. Here is how to calculate it correctly, what a healthy target looks like, and where the leaks hide.
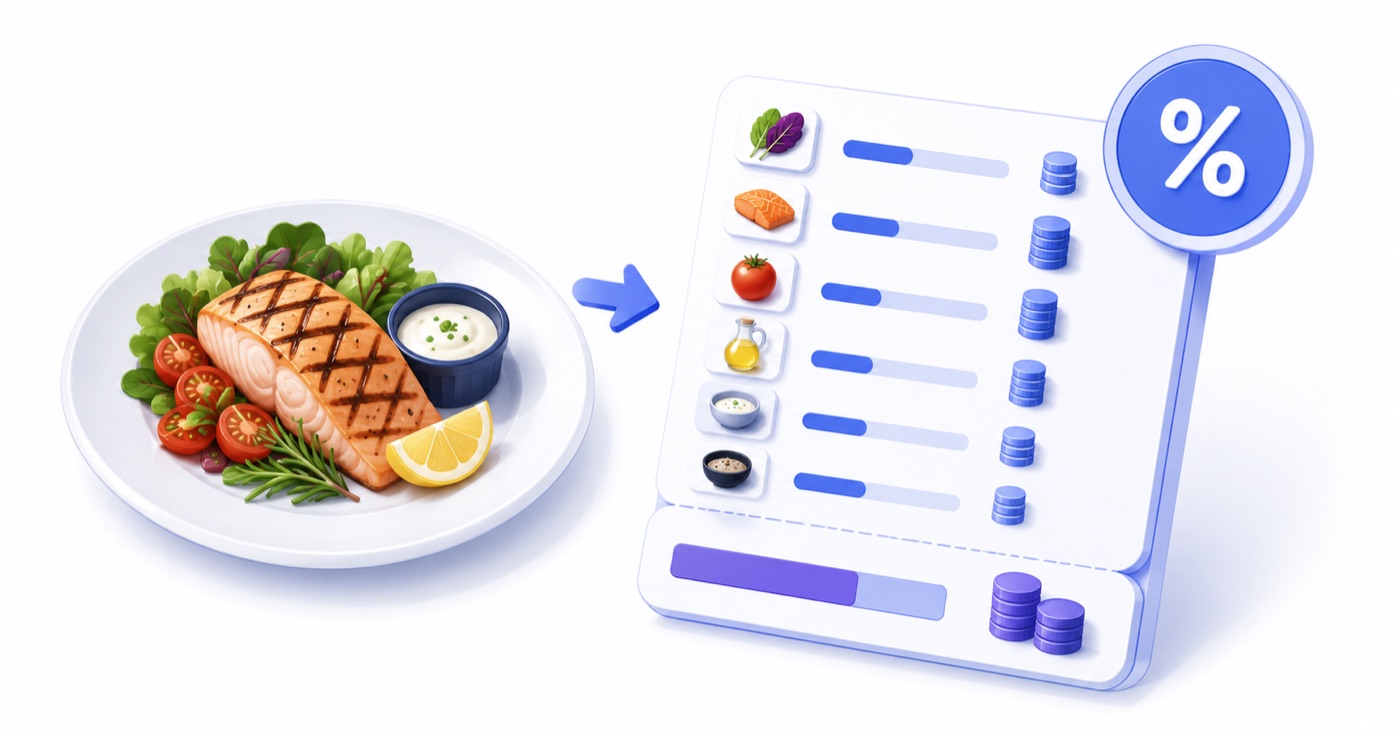
Table of Contents
The Primary Benchmark of Kitchen Profitability
Food cost percentage is the single most critical financial KPI in food and beverage (F&B) management. It tells an owner or executive chef exactly how many paisa out of every revenue rupee earned is spent on raw ingredient costs.
A restaurant generating ₹15,000,000 in annual revenue with an unmonitored food cost of **38%** will spend ₹57,000,000 on ingredients. If tight operational controls bring that food cost down to **29%**, the outlet reclaims ₹1,350,000 in net cash profit without selling a single extra plate of food.
---
The Complete Mathematical Calculation Framework
Calculating food cost percentage requires two distinct mathematical steps.
```
Step 1: Compute Cost of Goods Sold (COGS)
[Opening Inventory] + [Purchases / Invoices] - [Closing Inventory] = COGS (₹)
Step 2: Calculate Food Cost Percentage
( COGS (₹) ÷ Gross Food Sales (₹) ) × 100 = Food Cost %
```
1. Cost of Goods Sold (COGS) Formula
$$ ext{COGS} = ext{Opening Inventory Value} + ext{New Purchases & Freight} - ext{Closing Inventory Value}$$
2. Food Cost Percentage Formula
$$ ext{Food Cost (%)} = left( rac{ ext{COGS}}{ ext{Gross Food Sales (Excluding Taxes)}} ight) imes 100$$
---
Step-by-Step Practical Calculation Example
Consider an independent dining outlet over a 30-day operating period:
Step 1: Calculate COGS
$$ ext{COGS} = ₹1,20,000 + ₹4,80,000 - ₹1,40,000 = mathbf{₹4,60,000}$$
Step 2: Calculate Food Cost %
$$ ext{Food Cost (%)} = left( rac{₹4,60,000}{₹14,50,000} ight) imes 100 = mathbf{31.72%}$$
[!CAUTION]
**The Common Purchasing Fallacy:** Never calculate food cost by simply dividing monthly supplier bills by total sales. This ignores inventory fluctuations, making a month with heavy bulk purchases (e.g., buying a 3-month supply of basmati rice or oil) appear artificially unprofitable.
---
Target Food Cost Percentage Benchmarks by Outlet Concept
Food cost targets vary depending on service speed, menu complexity, and average check size:
| F&B Outlet Concept | Healthy Target Band | Key Cost Drivers | Operational Focus |
| :--- | :--- | :--- | :--- |
| **Quick Service Restaurant (QSR)** | **25% – 28%** | High volume, low labor, paper packaging | Portion control, high-speed assembly |
| **Casual Dining / Cafe** | **28% – 32%** | Moderate prep, standard proteins | Waste minimization, FIFO rotation |
| **Fine Dining / Steakhouse** | **32% – 38%** | Premium seafood, imported meats | High check size offsets higher ingredient % |
| **Hotel Breakfast Buffet** | **22% – 26%** | High carb/dairy, bulk cooking | Over-production control, tray sizing |
| **Bar / Beverage Division** | **18% – 24%** | High margin spirits, mixers, syrups | Spillage audit, free-pour restrictions |
---
Ideal (Theoretical) vs. Actual Food Cost Variance
To eliminate profit leaks, hoteliers must track the gap between **Ideal Food Cost** and **Actual Food Cost**:
$$ ext{Variance} = ext{Actual Food Cost %} - ext{Ideal Food Cost %}$$
Variance Root Cause Analysis Matrix:
| Variance Band | Severity | Primary Root Causes | Recommended Action |
| :--- | :--- | :--- | :--- |
| **0.0% – 1.0%** | Excellent | World-class kitchen discipline | Maintain standard SOPs |
| **1.1% – 2.5%** | Acceptable | Standard trim loss, minor prep spill | Re-calibrate portion scales |
| **2.6% – 5.0%** | Warning | Unlogged staff meals, over-portioning | Audit KOT vs kitchen output |
| **> 5.0%** | Critical | Supplier short-weight delivery, theft | Conduct emergency physical audit |
---
Frequently Asked Questions (FAQ)
Q1: How should kitchen staff handle complimentary food (comps) or guest satisfaction replacements?
Complimentary meals should be rung up on the POS as a **"Comp Ticket"** with 100% discount, linked to a specific Manager PIN. This removes the items from raw inventory while posting the cost to Marketing/Guest Relations expenses rather than inflating kitchen food cost.
Q2: How often should inventory stock-taking be performed?
Physical counts for expensive proteins (meat, seafood, cheese, liquor) should occur **daily**. Full pantry and dry store inventory counts should occur **weekly or monthly**.
Q3: How does automated recipe management in Antena simplify food cost tracking?
Antena's Restaurant OS stores digital yield-tested recipes for every menu item. When a waiter punches an order for *Paneer Butter Masala*, the system automatically deducts 180g of paneer, 40g of butter, and 120ml of tomato gravy from inventory in real time, calculating ideal food cost live.
About Soumya Srivastava
Founder
Soumya is the founder of Antena. A close interest in the day-to-day realities of running hotels and restaurants, paired with a technical background, shapes how she approaches hospitality software — starting from the operational problem rather than the feature list. She writes about the business thinking behind smoother front-desk, housekeeping, and F&B operations.
Related Articles
The Hidden Costs of Legacy Restaurant POS Systems
Your restaurant POS might have a cheap upfront cost, but disconnected systems create invisible revenue leaks every single shift.
Menu Engineering: Which Dishes Actually Make You Money
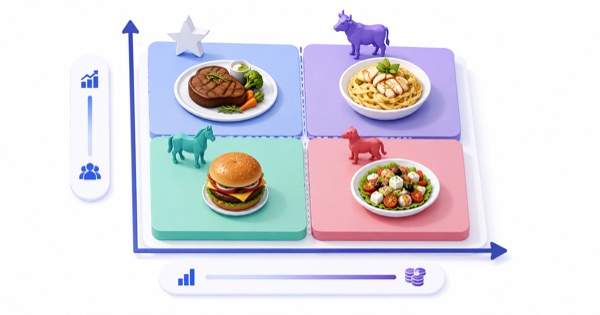
Your best-selling dish is not always your most profitable one. Menu engineering sorts every item by popularity and margin so you know what to promote, reprice, or retire.
Kitchen Stock-Taking: Par Levels, FIFO, and How Often to Count
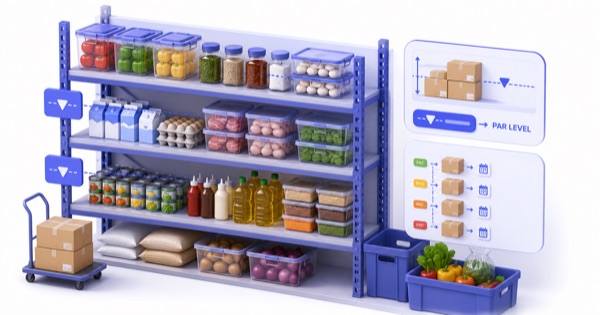
Disciplined stock-taking is what keeps a kitchen from over-ordering, running out, or quietly bleeding money to spoilage. Here is a practical system for a small kitchen.