Menu Engineering: Which Dishes Actually Make You Money
Your best-selling dish is not always your most profitable one. Menu engineering sorts every item by popularity and margin so you know what to promote, reprice, or retire.
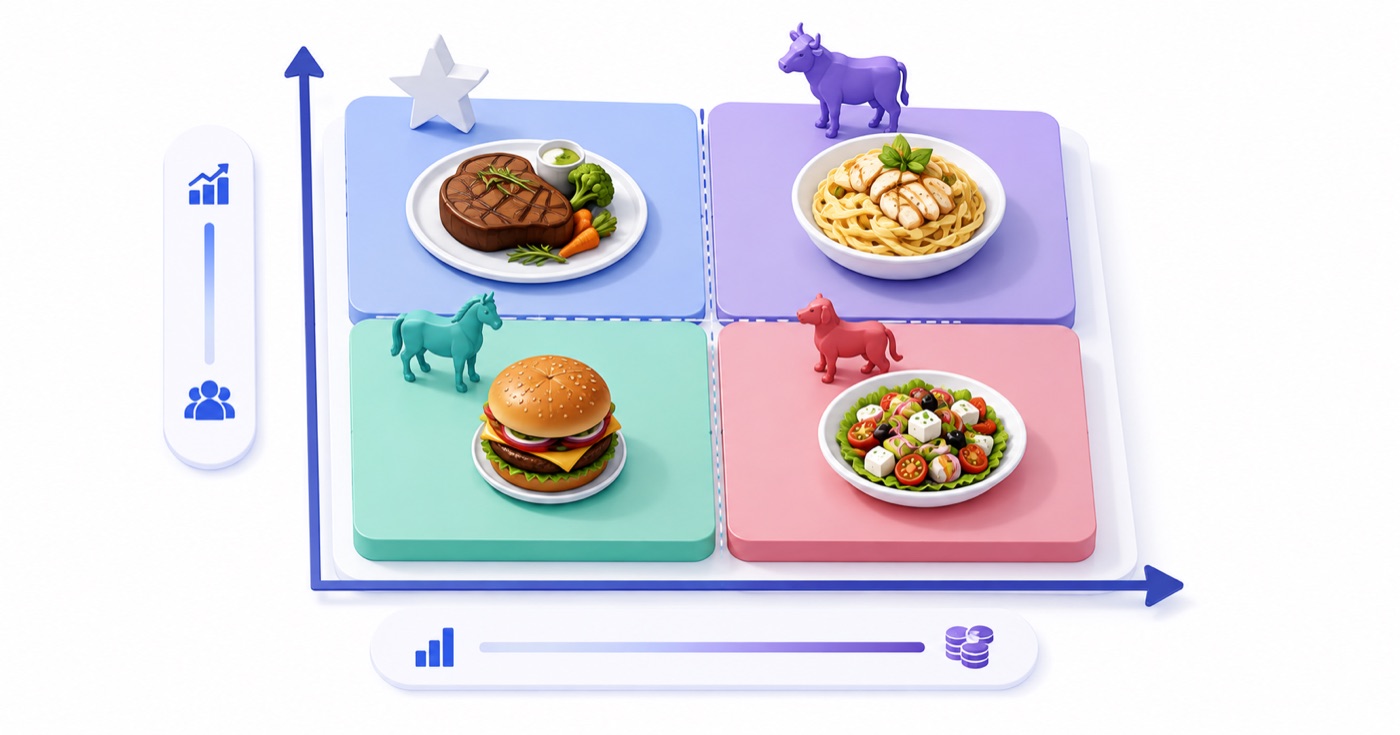
Table of Contents
The Strategic Science of Menu Engineering
In most independent restaurants and hotel dining rooms, menu pricing and item placement are treated as artistic decisions. Owners design menus based on culinary intuition or competitor prices.
However, **Menu Engineering**—originally developed by Michael Kasavana and Donald Smith at Michigan State University—transforms your menu into a high-yield sales vehicle. It evaluates every dish on two independent metrics:
A crowd-favorite dish that sells 400 portions a month but yields a slim ₹40 cash margin is actually losing you money compared to a dish that sells 80 portions but yields a ₹380 cash margin.
---
The Kasavana & Smith 2x2 Menu Engineering Matrix
By plotting every item against average volume and average contribution margin, dishes fall into four distinct operational quadrants:
```
HIGH CONTRIBUTION MARGIN (₹)
▲
│
[PUZZLES] │ [STARS]
Low Volume / High Margin │ High Volume / High Margin
Action: Reposition / Pitch │ Action: Protect & Maintain
───────────────────────────────────┼───────────────────────────────────► HIGH POPULARITY (Volume)
[DOGS] │ [PLOWHORSES]
Low Volume / Low Margin │ High Volume / Low Margin
Action: Prune or Rework │ Action: Reprice or Re-portion
│
LOW CONTRIBUTION MARGIN (₹)
```
---
The Mathematical Formulas Behind Menu Matrix Categorization
1. Contribution Margin Formula (Cash Profit per Dish)
$$ ext{Contribution Margin (CM)} = ext{Selling Price (Excl. Tax)} - ext{Portion Food Cost}$$
[!NOTE]
**Cash Margin vs. Margin %:** Menu engineering focuses on **Rupee Cash Margin**, not percentage margin. A ₹1,200 steak dish with a 40% food cost yields ₹720 cash profit. A ₹150 soup dish with a 20% food cost yields only ₹120 cash profit. The steak pays more rent than the soup.
2. Menu Mix Percentage (Popularity Threshold)
$$ ext{Menu Mix %} = left( rac{ ext{Number of Dish Units Sold}}{ ext{Total Entrees Sold Across Menu}} ight) imes 100$$
$$ ext{Popularity Benchmark} = left( rac{100%}{ ext{Total Menu Items}} ight) imes 0.70$$
An item is categorized as "High Popularity" if its sales volume exceeds **70% of the average expected sales share**.
---
Quadrant Action Matrix & Tactical Strategies
Below is the operational action plan for each quadrant:
| Quadrant | Volume | Cash Margin | Operational Action Strategy |
| :--- | :--- | :--- | :--- |
| **⭐ STARS** | High | High | **Protect & Feature:** Position in prime eye-path zones (top right of menu page), maintain strict recipe consistency, never discount. |
| **🐎 PLOWHORSES** | High | Low | **Reprice / Re-portion:** Increase selling price by 5–8% (high-volume items absorb minor price increases easily), reduce garnish/portion size slightly, or substitute expensive sub-ingredients. |
| **🧩 PUZZLES** | Low | High | **Reposition & Promote:** Rewrite menu description with sensory keywords ("hand-crafted", "slow-roasted"), direct waiters to verbally recommend, or move out of menu footers. |
| **🐕 DOGS** | Low | Low | **Prune or Re-engineer:** Eliminate from next menu printing to clean up kitchen inventory, or transform into a higher-margin daily special. |
---
Practical Case Study: Evaluating 4 Entrees
Consider a 30-day sales mix report from a casual hotel restaurant:
| Dish Name | Units Sold | Selling Price | Item Cost | CM (₹) | Quadrant | Tactical Action |
| :--- | :--- | :--- | :--- | :--- | :--- | :--- |
| **Butter Chicken** | 350 (35%) | ₹450 | ₹180 | ₹270 | **⭐ STAR** | Keep prominent, ensure consistent gravy prep. |
| **Dal Tadka** | 400 (40%) | ₹220 | ₹60 | ₹160 | **🐎 PLOWHORSE**| Raise price to ₹250. Adds +₹12,000 cash profit. |
| **Lamb Rogan Josh**| 40 (4%) | ₹650 | ₹280 | ₹370 | **🧩 PUZZLE** | Re-describe as "Chef's Signature 6-Hour Slow-Cooked Lamb". |
| **Boiled Veg Platter**| 30 (3%) | ₹280 | ₹140 | ₹140 | **🐕 DOG** | Remove from menu. Reclaim fridge space. |
---
Frequently Asked Questions (FAQ)
Q1: Should low-margin "Dogs" ever be kept on a restaurant menu?
Yes, selectively. A "Dog" item may be retained if it fulfills a critical dietary requirement (e.g., a gluten-free or vegan option) or serves as a children's meal anchor that enables a family of 4 to dine at your outlet.
Q2: How frequently should a restaurant conduct a menu engineering matrix review?
Menu engineering should be conducted **quarterly** or whenever raw ingredient prices rise by more than 5%.
Q3: How does Antena's Restaurant OS automate menu engineering?
Antena automatically aggregates sales mix volume from POS KOTs alongside recipe ingredient costs, automatically plotting your live menu quadrant matrix on your dashboard without manual Excel spreadsheets.
About Soumya Srivastava
Founder
Soumya is the founder of Antena. A close interest in the day-to-day realities of running hotels and restaurants, paired with a technical background, shapes how she approaches hospitality software — starting from the operational problem rather than the feature list. She writes about the business thinking behind smoother front-desk, housekeeping, and F&B operations.
Related Articles
The Hidden Costs of Legacy Restaurant POS Systems
Your restaurant POS might have a cheap upfront cost, but disconnected systems create invisible revenue leaks every single shift.
How to Calculate Food Cost Percentage (and Hit a Healthy Target)
Food cost percentage is the single number that tells you whether your kitchen is making money. Here is how to calculate it correctly, what a healthy target looks like, and where the leaks hide.
Kitchen Stock-Taking: Par Levels, FIFO, and How Often to Count
Disciplined stock-taking is what keeps a kitchen from over-ordering, running out, or quietly bleeding money to spoilage. Here is a practical system for a small kitchen.